
Expanding a physical retail footprint is one of the highest-capital decisions an executive team can make. Signing a commercial lease binds a brand to a location for five, ten, or fifteen years. If the site underperforms, relocation costs, lost capital expenditures, and brand dilution can take years to recover from.
Historically, site selectors relied on drive-by inspections, broker recommendations, and static census demographic reports. Today, the most resilient retail chains treat location selection as an algorithmic discipline. They combine spatial analytics, co-tenancy patterns, and real-time competitor intelligence to validate every market before signing a lease.
For example, take a look at this location map for Americas Best Value Inn hotels.
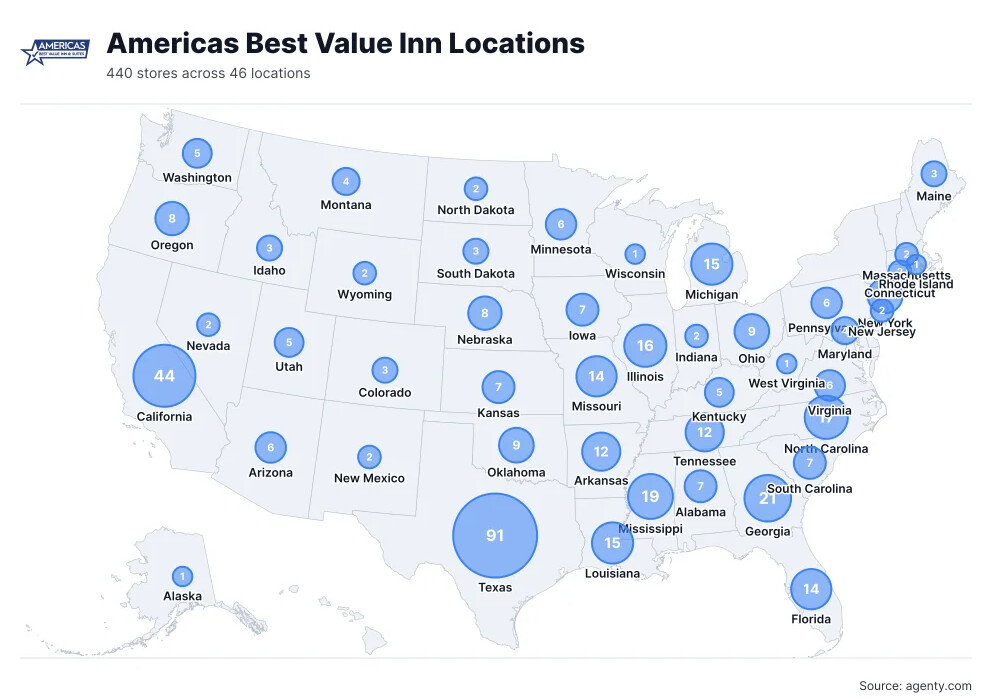
The map gives you an instant view of how a brand is distributed across the country. But the real value goes beyond plotting locations on a map.
For example, the current Americas Best Value Inn dataset contains 441 US locations with geocoded latitude/longitude, addresses, phone numbers, domains, and other property details.
The distribution data also shows that Texas has the largest number of locations, followed by California and Georgia, while Houston has the highest concentration among individual cities.
This is where raw web data becomes useful business intelligence.
Core Fundamentals of Retail Site Selection
Finding the right physical site requires balancing consumer convenience with commercial viability. Every viable territory passes through four operational filters before physical properties are even evaluated.
Catchment Area and Drive-Time Isodistances
Static mileage radiuses (such as three-mile or five-mile rings) often fail to reflect actual customer behavior. Geographical barriers like rivers, rail lines, highway divides, and arterial congestion distort travel patterns.
Modern site selectors evaluate trade areas using drive-time isodistances (polygons representing actual travel times under peak and off-peak traffic conditions):
- Primary Trade Area: The zone that generates 60% to 70% of regular foot traffic, typically within a 5 to 10-minute drive.
- Secondary Trade Area: The zone generating an additional 15% to 20% of shoppers, usually within 10 to 15 minutes.
- Tertiary (Fringe) Trade Area: The outermost boundary where destination shoppers originate, typically extending out to 25 or 30 minutes for specialized retail categories.
Co-Tenancy and Complementary Anchors
Retail stores do not exist in isolation; they thrive inside ecosystems. Identifying complementary co-tenants allows a growing brand to leverage traffic generated by established non-competing businesses.
A specialty pet supply retailer benefits significantly from positioning next to a high-traffic grocery chain or a veterinary clinic. Similarly, fast-casual dining brands capture higher throughput when placed near fitness centers, daytime office hubs, or big-box discount retailers.
Access, Ingress, and Egress
A location with high traffic volume is worthless if drivers cannot easily enter the parking lot. Critical physical access factors include:
- Signalized intersections with dedicated left-turn lanes.
- Curb-cut quantity and positioning along major roadways.
- Visible sightlines from approaching traffic at posted speed limits.
- Parking ratios that meet peak weekend rush requirements without gridlock.
Analyzing Competitor Footprints to Guide Expansion
One of the most reliable predictors of site viability is competitor behavior. Market leaders invest heavily in real estate research teams, traffic engineering studies, and site scoring algorithms. Tracking where competing brands open new units, where they cluster, and where they avoid provides direct validation for your own market entry.
The Fast-Follower Strategy
Retailers frequently adopt a fast-follower real estate model. Rather than spending hundreds of thousands of dollars on speculative market studies, brands position their units directly adjacent to successful market incumbents.
Consider discount grocery and hardware chains expanding across suburban corridors. When discount grocers evaluate new trade areas, analyzing existing chains provides an immediate baseline. For example, teams evaluating new discount grocery markets study the spatial footprint of Lidl store locations in the USA to identify territories where value-oriented grocery shoppers already congregate.
In the home improvement and tool sectors, regional expansions often shadow established market leaders. Hardware brands looking for secondary markets regularly study Harbor Freight Tools store locations in the USA or Menards store locations in the USA to spot underserved exurban markets where contractor and DIY demand remains dense.
Identifying White Space and Market Saturation
A high density of competitors can signal healthy demand, but it can also signal an oversaturated trade area where unit economics deteriorate.
Retailers in specialty categories must identify the saturation threshold. For example, hard-surface flooring and home renovation brands evaluate regional footprints, such as existing Floor & Decor store locations in the USA, to calculate the geographic gap between existing outlets. If two anchor stores are separated by 30 miles of high-density residential growth, that corridor represents a viable candidate for infill expansion.
Similarly, quick-service and fast-casual concepts track the distribution of Chipotle store locations in the USA to determine whether a corridor can sustain additional fast-casual concepts or whether daytime lunch traffic is already split among too many options.
A Step-by-Step Framework for Site Expansion
Executing a systematic expansion strategy requires moving from macro-market screening to micro-site selection using verifiable data points.
| Expansion Stage | Focus Area | Key Data Inputs | Output Metric |
|---|---|---|---|
| Stage 1: Macro Screening | Metropolitan statistical areas (MSAs) | Population growth, disposable income, commercial vacancy | Top 3 target regional markets |
| Stage 2: Trade Area Filtering | Specific sub-markets and corridors | Drive-time isodistances, zoning rules, traffic counts | Identified target intersections |
| Stage 3: Micro Site Analysis | Individual properties and parcels | Ingress/egress, co-tenancy, parking ratios, rent per sq ft | Site score out of 100 |
| Stage 4: Competitive Validation | Proximity to rivals and anchors | Competitor store counts, foot traffic data, map changes | Cannibalization and market share estimate |
Step 1: Define Target Customer Profiles and Spatial Thresholds
Before examining real estate listings, define the demographic and geographic criteria that correlate with high unit sales:
- Median household income within the 10-minute drive polygon.
- Daytime working population versus residential evening population.
- Percentage of homeownership versus renter occupancy.
- Minimum daily traffic counts along the primary access road.
Step 2: Extract Competitor Location Data
To evaluate target territories accurately, teams need structured location data from competitor websites rather than static address lists. This requires extracting latitude, longitude, store formats, opening dates, and operating hours from target retailers across the region.
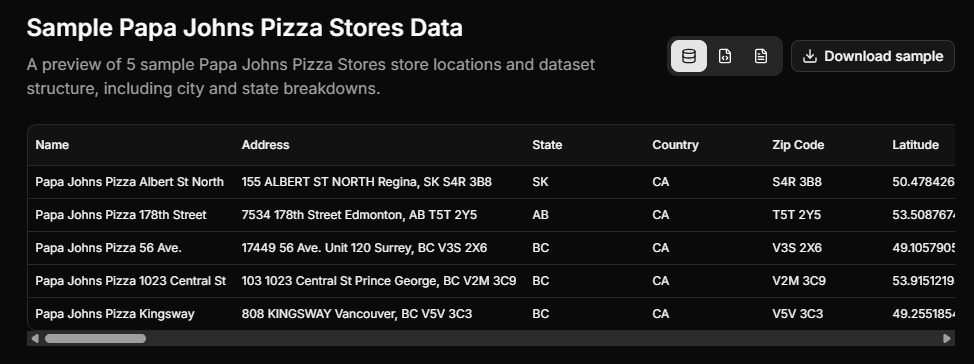
Organizations extract these data feeds directly from store locators using a scraping agent. Automating this process provides current, accurate spatial coordinates across thousands of locations without manual entry errors.
Step 3: Monitor Map and Footprint Changes
Retail real estate moves rapidly. Competitors quietly announce planned stores, acquire permits, and adjust operating hours months before an opening becomes common knowledge in the trade press.
Using map monitoring allows expansion teams to detect changes across geographic directories, new location listings, and zoning updates as they occur. When a competitor lists a “Coming Soon” pin on their locator map, real estate teams can immediately evaluate whether that sub-market remains viable for their own store.
Step 4: Quantify Cannibalization Risks
When expanding an existing network, every new store risks taking sales from an established company location. Retailers manage this risk through spatial cannibalization modeling:
- Map existing customer billing zip codes or mobile device visit origins.
- Overlay the proposed store’s 10-minute drive-time polygon on top of adjacent units.
- Calculate the percentage of overlapping households.
- Discount projected revenue for the new location by the estimated cannibalization percentage (typically aiming to keep sales transfer under 15% of the existing store’s base).
Building a Predictive Site Scorecard
To remove personal bias from expansion reviews, real estate committees use standardized scoring matrices. Each property is scored across weighted categories to generate an objective rating.
Site Viability Score = (Demographic Match × 0.30)
                     + (Traffic & Access × 0.25)
                     + (Anchor & Co-Tenancy × 0.20)
                     + (Competitive Proximity × 0.15)
                     + (Cost & Lease Terms × 0.10)
1. Demographic Alignment (30%)
Calculates how closely the trade area matches top-quartile existing stores. Criteria include household formation rates, disposable income, average age, and population density within the primary drive-time polygon.
2. Traffic Flow and Access (25%)
Evaluates daily vehicular volume, clear visibility from main thoroughfares, ease of turning across traffic, and pedestrian flow in urban corridors.
3. Anchor Health and Co-Tenancy (20%)
Assesses the stability of adjacent retailers in the commercial strip or shopping center. Strong grocery anchors, high-frequency specialty retailers, and low center vacancy increase this sub-score.
4. Competitive Dynamics (15%)
Measures the balance between customer convenience and category competition. Sites that sit adjacent to high-traffic complementary retailers while maintaining adequate separation from direct rivals score highest.
5. Occupancy Costs and Lease Economics (10%)
Weighs triple-net (NNN) charges, base rent per square foot, tenant improvement allowances, and buildout costs against projected revenue to ensure acceptable payback periods.
Operational Pitfalls to Avoid
Even well-funded expansion plans stumble when operational and spatial realities are overlooked during site selection.
Relying Exclusively on Census Data
Census figures are often years old. In high-growth suburban corridors, subdivisions, apartment complexes, and feeder roads appear faster than federal databases reflect. Combine static census data with real-time building permit filings, school enrollment numbers, and commercial development filings to assess current market conditions accurately.
Ignoring Morning Versus Evening Commute Side
The side of the street matters depending on your retail category. Convenience stores, coffee shops, and bakeries must sit on the morning commute side of the road (outbound from residential, inbound toward employment centers). Sit-down restaurants, grocery stores, and evening destination retailers perform far better on the homeward commute side, where drivers can turn in without crossing oncoming rush-hour traffic.
Underestimating Local Zoning and Signage Restrictions
A visually prominent parcel can become an underperforming store if municipal sign codes prevent highway pylon signs, restrict building facade illumination, or prohibit outdoor product displays. Thorough due diligence requires reviewing local planning board ordinances before removing lease contingencies.